Gathering Diagnostic Logs and Crash Dumps
If you’re experiencing crashes or hangs, these steps will allow you to gather the crash dumps and logs for analysis.
Capturing Logs
Section titled “Capturing Logs”-
Open Terminal.
-
Run the following command:
log collect \
--predicate ‘eventMessage CONTAINS[c] "peakhour"' \
--last 12h \
--output ~/Desktop/PeakHourLogs.logarchive
Change the ‘last’ argument to capture the time period in question (e.g. ‘30m’ for the last 30 minutes, ‘2d’ for the last 2 days etc.) -
Send the file PeakHourLogs.logarchive as directed.
Capturing SNMP / UPnP Debug Logs
Section titled “Capturing SNMP / UPnP Debug Logs”-
Quit PeakHour
-
Open Terminal.
-
To enable SNMP debug logging, run the following command:
defaults write com.digitician.peakhour5 EnableSNMPDebugLogging -bool YES -
To enable UPnP debug logging, run the following command:
defaults write com.digitician.peakhour5 EnableUPnPDebugLogging -bool YES
-
-
Run the following command to enable writing debug log events to disk:
sudo log config --mode "level:debug,persist:debug" --subsystem com.digitician.peakhour5 -
Start PeakHour and reproduce the issue.
-
When the issue has been reproduced, run the following command in Terminal:
log collect --predicate 'subsystem BEGINSWITH "com.digitician.peakhour" AND (category == "upnp" OR category == "snmp")' \
--last 12h \
--output ~/Desktop/PeakHourLogs.logarchive -
Run the following command to disable debug log writing:
sudo log config --mode "level:default,persist:default" --subsystem com.digitician.peakhour5 -
Send the file PeakHourLogs.logarchive as directed.
-
To disable SNMP / UPnP debug logging, run the following commands:
defaults delete com.digitician.peakhour5 EnableSNMPDebugLogging
defaults delete com.digitician.peakhour5 EnableUPNPDebugLogging
Capturing Logs (manual method)
Section titled “Capturing Logs (manual method)”-
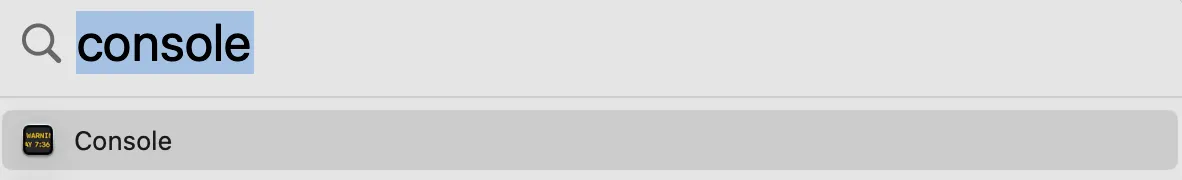
Click the Spotlight (magnifying glass) icon in the top-right corner of the screen.
-
Type ‘Console’ - when you see the Console app highlighted, tap Enter.
-
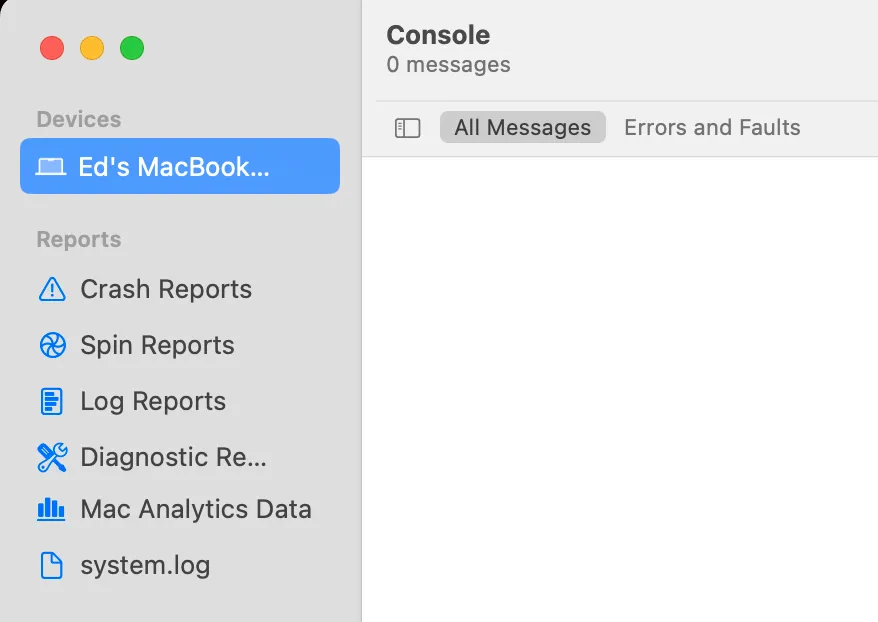
If the Sources view is not visible down the left-side, choose View > Show Sources.
-
In the Sources view, choose the top most source under Devices. It will be called the same name as your Mac.
-
In the search field, type
peakhourand press Enter.
-
In the Action menu, ensure Include Info Messages and Include Debug Messages are enabled.

-
Click Start Streaming to start gathering logs.
-
Reproduce the problem / issue you’re having.
-
Once the problem is reproduced, go back to Console.
-
Choose Edit > Select All then Edit > Copy.
-
Save the contents of the clipboard to a file, attach into an email.
DO NOT paste directly into a message, as long messages can crash some email clients. -
Send the log file to support, as directed.
Sending Crash Dumps
Section titled “Sending Crash Dumps”-
Click the Spotlight (magnifying glass) icon in the top-right corner of the screen.
-
Type ‘Console’ - when you see the Console app highlighted, tap Enter.
-
If the Sources view is not visible down the left-side, choose View > Show Sources.
-
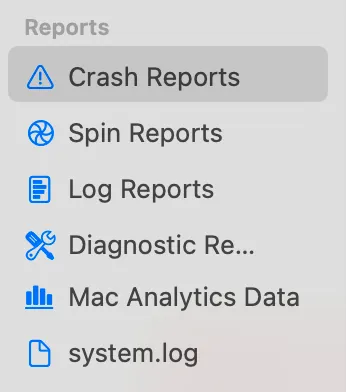
In the Sources view, choose Crash Reports.
-
Locate reports related to PeakHour.
-
Choose one and choose Reveal in Finder.
-
Right-click the file in Finder and choose Share > Mail or drop as an attachment in your email client and send to [email protected].
Was this page helpful?
Found something wrong, unclear, or out of date? Let us know and we'll fix it.