Latency Monitors
Latency Monitors (previously called Connection Quality Monitors) measure round-trip latency, jitter, and packet loss to hosts on the internet. They appear at the bottom of the Main View.
What they measure
Section titled “What they measure”| Metric | Description |
|---|---|
| Latency | Round-trip time for a single ping, in milliseconds. |
| Jitter | Variation in latency over time. High jitter suggests an unstable connection. |
| Packet loss | Percentage of pings that didn’t get a reply. |
Higher latency, jitter, or packet loss can indicate problems on your network or along the route to a host.
Single-hop vs differential
Section titled “Single-hop vs differential”A Latency Monitor can target a single host (for example, 1.1.1.1) or measure the difference between two hops (for example, Router → ISP). Differential measurements isolate problems to specific portions of the path, which is how the Internet Dashboard measures latency to your router and ISP.
Section header
Section titled “Section header”The header bar above the monitors holds controls for the whole Latency Monitors section:

From left to right:
| Control | Description |
|---|---|
| Show / Hide | Collapses or expands the entire Latency Monitors section. |
| New Monitor | Adds a new Latency Monitor via the Configuration Assistant. |
| Counts | Summarises monitors by status, with a colored dot for each: green for Active, yellow for Warning, red for Error, and grey for Disabled. |
| Shared Y Axis | Puts every monitor’s graph on the same vertical scale so latency can be compared directly. |
| Open History | Shows a menu of this section’s monitors; choose one to open its History view. |
Reading the graph
Section titled “Reading the graph”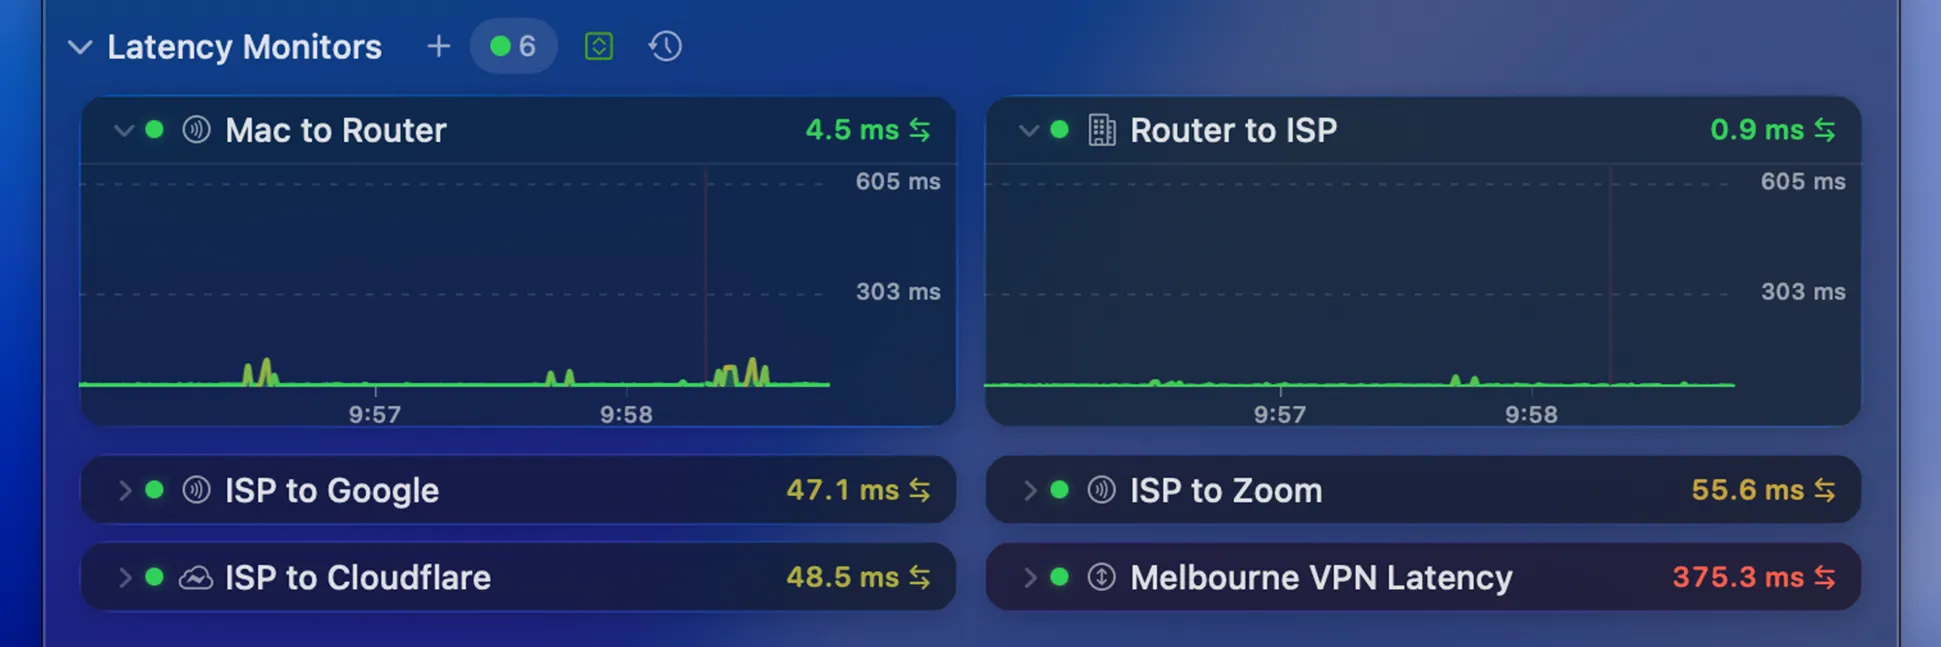
Each monitor shows the latest latency value, a colored quality indicator, and a graph of recent measurements. Hover over an expanded graph to reveal the graph toolbar below.
A single monitor packs more detail than it first appears:
Along the top of each monitor, from left to right:
- Disclosure triangle — expands or collapses the monitor’s graph, leaving just the title and current latency visible.
- Status light — a colored dot showing the monitor’s current state: green for Active, yellow for Warning, red for Error, and grey for Disabled.
- Symbol — the icon representing the target or path being measured. This can be configured in Settings → Latency Monitor.
- Name — the monitor’s label. Set this in Settings → Latency Monitor.
- Current latency — the most recent round-trip time, in milliseconds.
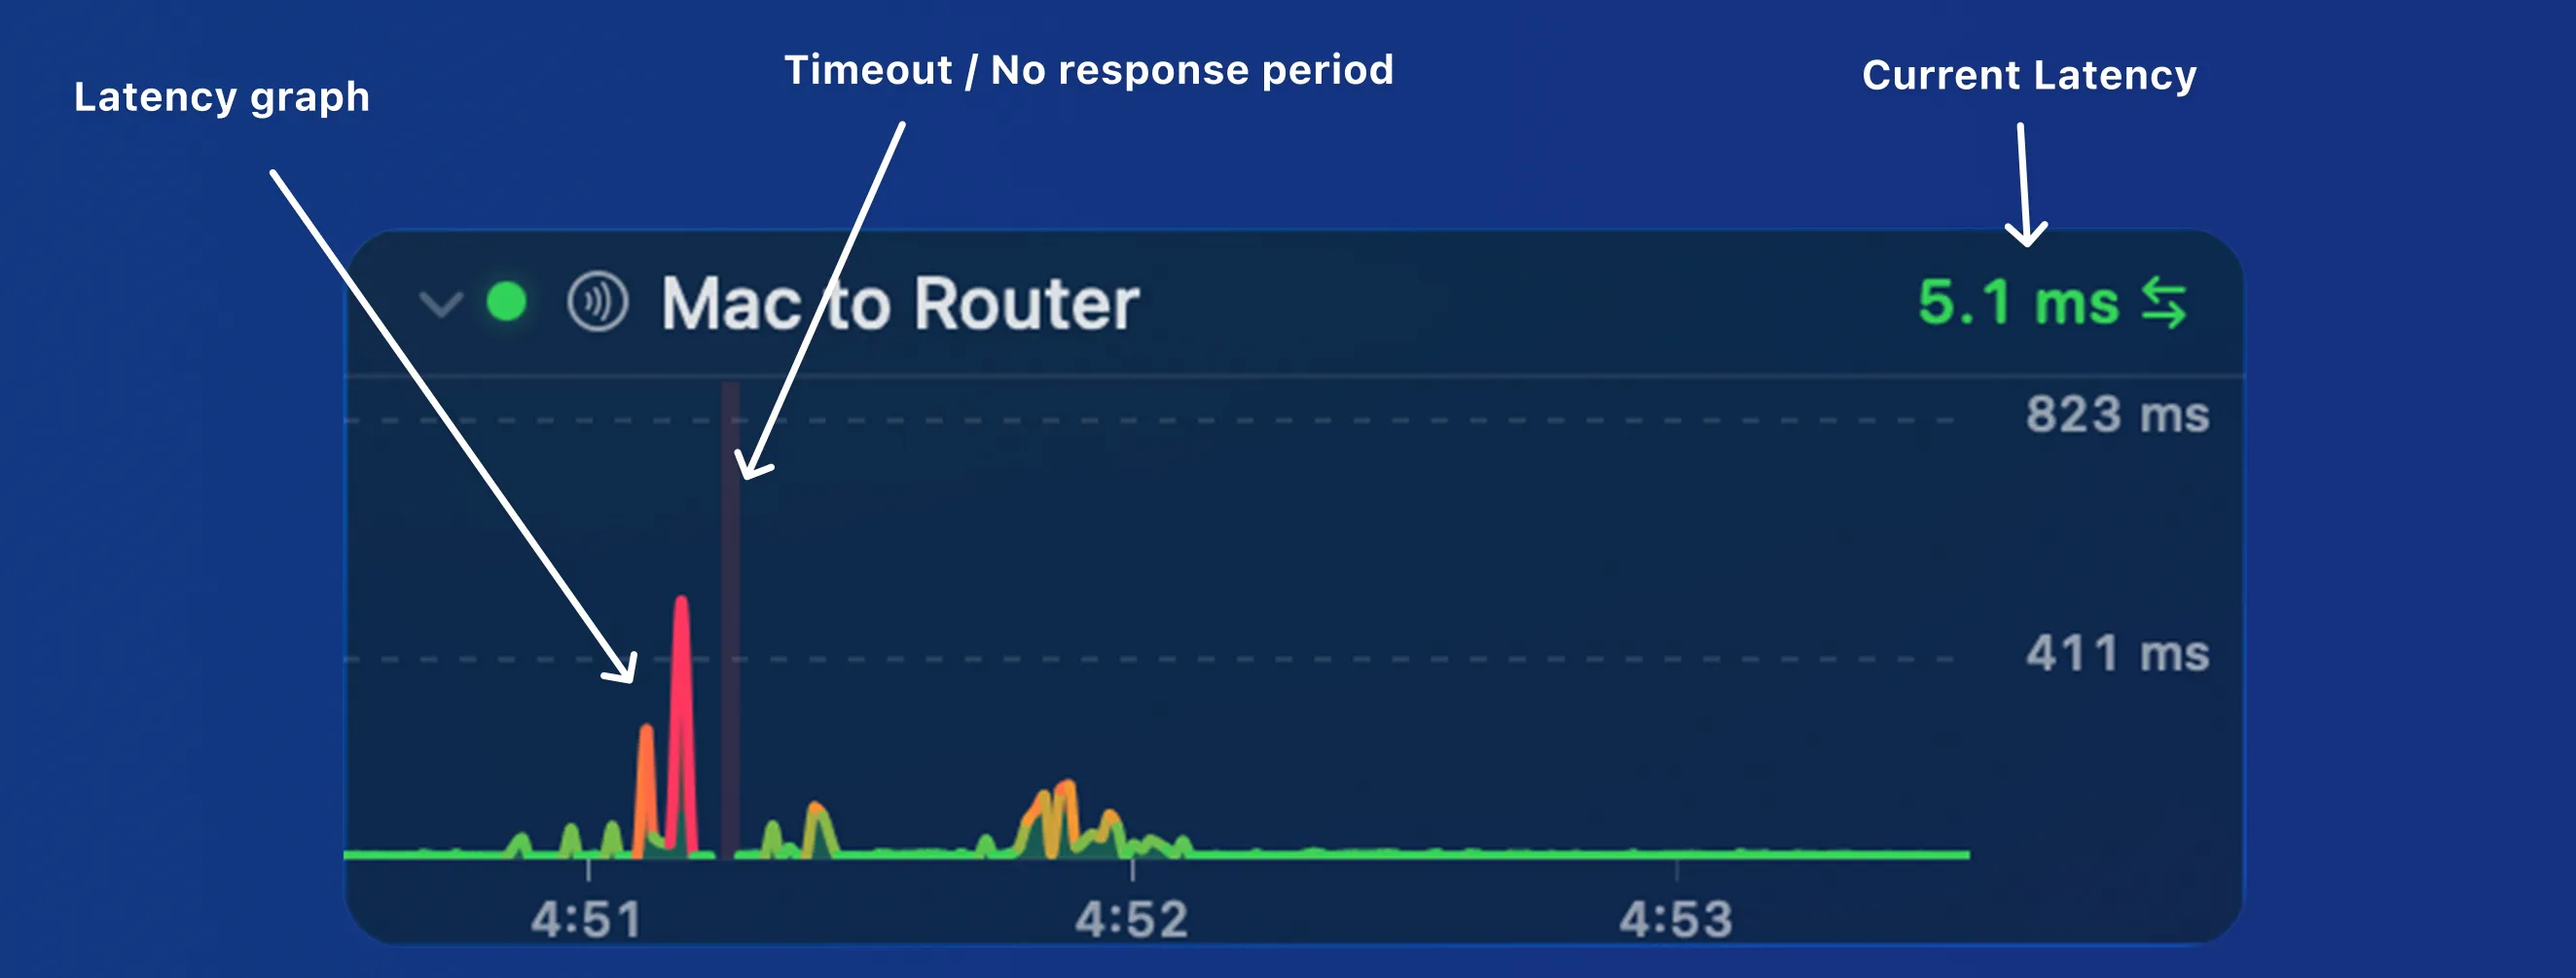
The graph itself adds a couple more details:
- Latency graph — plots recent round-trip times, colored by quality so spikes and slow responses stand out at a glance.
- Timeout / No response — pings that didn’t get a reply are drawn as red marks, making packet loss easy to spot.
Configuring
Section titled “Configuring”Add, remove, and customize Latency Monitors from Settings → Latency Monitor, where you can adjust polling intervals, latency thresholds, packet count, and colors.
Graph toolbar
Section titled “Graph toolbar”Hover over an expanded graph to reveal its toolbar:

From left to right:
| Control | Description |
|---|---|
| Probe-method pill | Appears only when the monitor has fallen back from standard ping. The label shows the method in use — UDP TTL, TCP, or HTTP. See Probe methods below. |
| Zoom out | Zooms the graph out, showing more time. |
| Zoom in | Zooms the graph in, showing less time. |
| Share | Shares the graph via Mail, Messages, AirDrop, etc. |
| History | Opens the History view for this target. |
| Settings | Opens the settings for this monitor in Settings → Latency Monitor. |
Probe methods
Section titled “Probe methods”Latency Monitors normally measure round-trip time with standard ICMP ping. If ping is blocked or stops getting replies, PeakHour automatically falls back to another method so monitoring keeps working — stepping down through UDP TTL, then TCP, then HTTP until something succeeds.
Whenever a monitor is running on anything other than ping, the toolbar shows a small pill with the active method’s name. PeakHour keeps retrying the better methods in the background and clears the pill automatically once ping recovers (usually within a few minutes).
Was this page helpful?
Found something wrong, unclear, or out of date? Let us know and we'll fix it.