Bandwidth Monitor
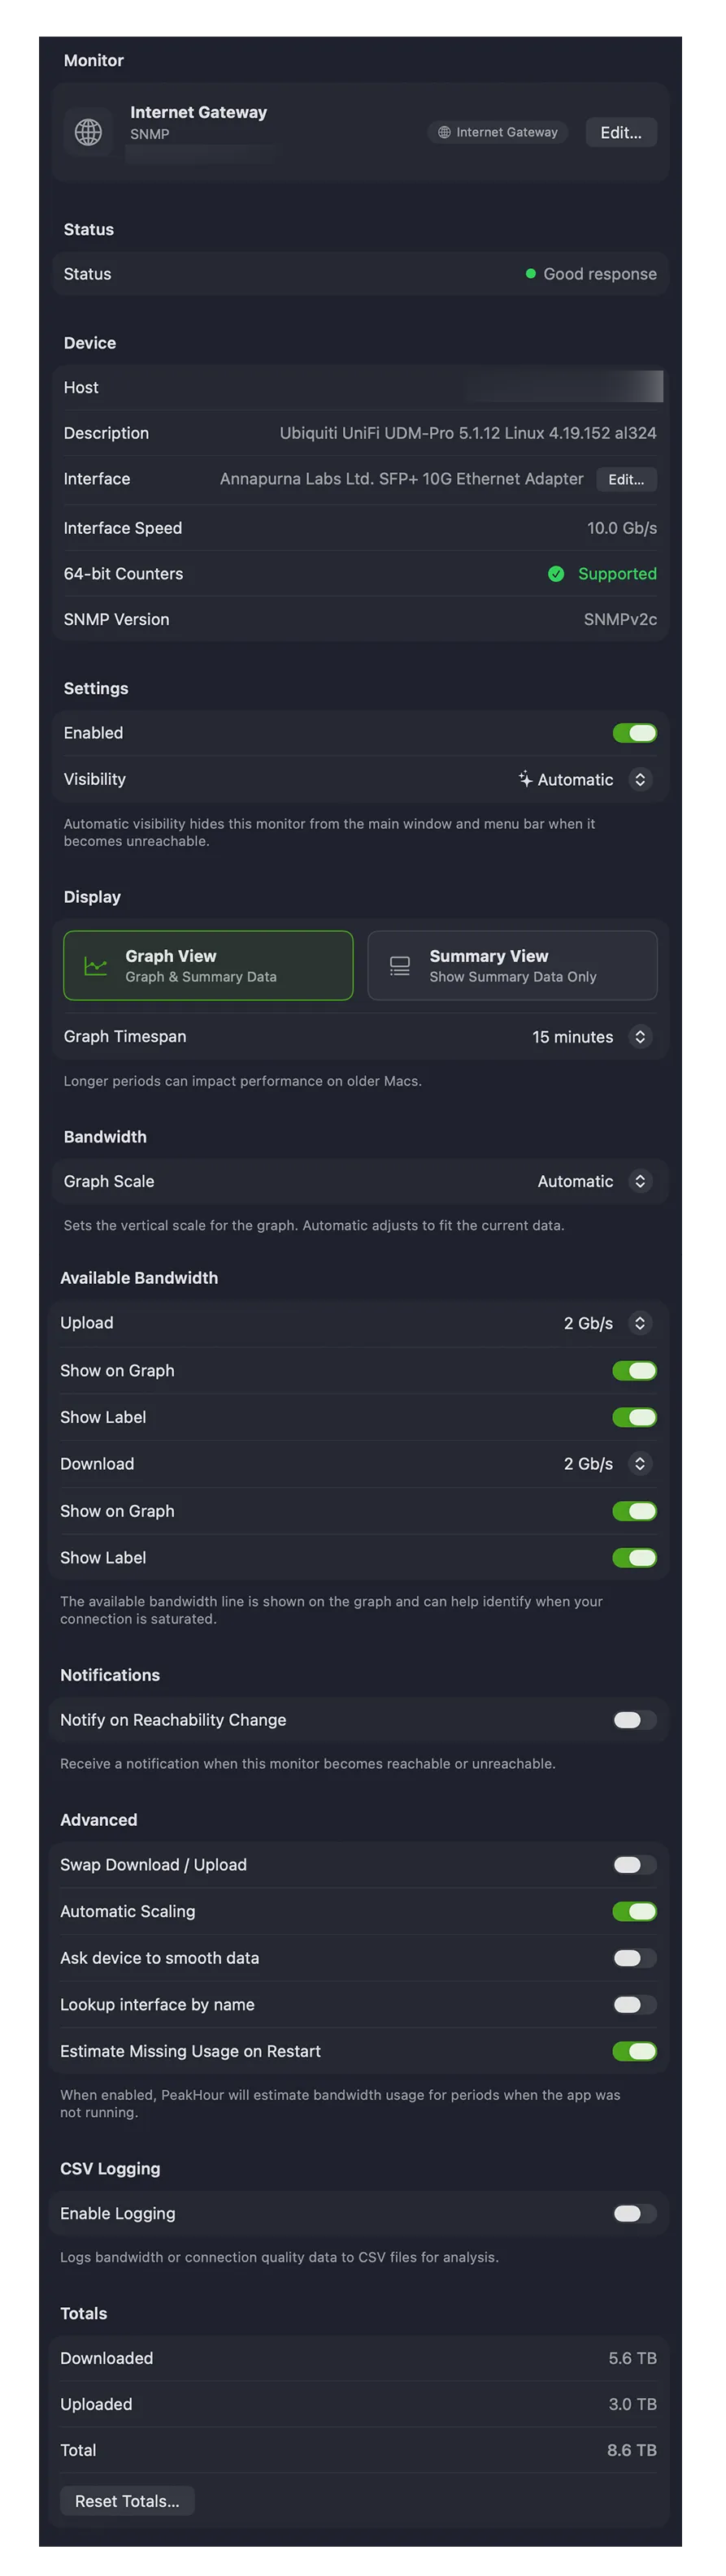
A Bandwidth Monitor measures the upload and download throughput of a device. Its settings are shown on a single scrolling page, organised into the sections below. To open them, select the monitor in the Monitors list — or right-click it and choose Edit….
Monitor
Section titled “Monitor”The identity of the monitor.
| Field | Description |
|---|---|
| Symbol | The icon for the monitor. Click it to open the symbol picker and choose a different one; it appears in the main view, History view, and (optionally) the menu bar. |
| Name | The description PeakHour uses to refer to this monitor throughout the app. Set something meaningful. |
| Internet Gateway | A pill shown when this monitor is designated as your network’s Internet Gateway — used for usage monitoring, and its throughput appears in the Internet Dashboard. See Designating a Monitor. |
| Edit… | Opens the Configuration Assistant to change how the device is connected and monitored. |
Status
Section titled “Status”Shows whether the device is currently responding to queries.
Device
Section titled “Device”Connection details for the monitored device. The fields shown depend on whether the device is monitored over SNMP or UPnP.
For an SNMP device:
| Field | Description |
|---|---|
| Host | The hostname or IP address of the device. |
| Description | The system description (sysDescr). |
| Interface | The name of the interface being monitored. |
| Interface Speed | The reported link speed of the interface. |
| 64-bit Counters | Whether the interface supports high-capacity (64-bit) counters. These are needed to measure high-speed links accurately, and for accurate usage tracking — especially when PeakHour isn’t always running, since 32-bit counters can roll over while it’s stopped. See Usage Monitoring. |
| SNMP Version | The SNMP version in use — v1, v2c, or v3. |
For a UPnP device:
| Field | Description |
|---|---|
| Name | The device’s friendly name (e.g. UniFi Dream Machine). |
| Manufacturer | The device’s manufacturer (e.g. Ubiquiti Networks). |
| Model | The device’s model and identifier (e.g. UDM-Pro). |
| Serial Number | The device’s serial number. |
| Endpoint | The UPnP root description URL (e.g. http://192.168.1.1:42111/rootDesc.xml). |
| WAN Access Type | The connection technology the device reports (e.g. Cable, Fiber, DSL). |
| Max Downstream / Max Upstream | The maximum downstream and upstream link rates the device reports. |
Settings
Section titled “Settings”| Field | Description |
|---|---|
| Enabled | Turns monitoring of this device on or off. |
| Visibility | Whether the monitor appears in the main window. Automatic hides it when it can’t be reached; Always Visible always shows it; Always Hide always hides it. A hidden monitor still runs and gathers data. |
Display
Section titled “Display”Controls how the monitor appears in the main window.
View mode
- Graph View — shows the monitor with its graph as well as the details. You can also toggle the graph with the disclosure triangle.
- Summary View — shows just the inbound (download) and outbound (upload) speed, without the graph.
Graph Threshold — how many minutes of data the main graph retains. You can scroll the graph vertically to see up to 12 hours back; larger values can affect performance. For older data, use the History view.
The Download and Upload graph colors are set globally for all monitors — see Display → Bandwidth Colors.
Bandwidth
Section titled “Bandwidth”Sets the graph scale and the maximum throughput the device is capable of.
Graph Scale
- Automatic — the graph scales to fit whatever is currently on screen.
- Available Bandwidth — scales to the maximum inbound/outbound bandwidth (whichever is greater).
- Fixed — a specific fixed scale.
Available Bandwidth (upload and download) — the maximum throughput for the device. It’s used to draw the maximum-bandwidth line and, when Graph Scale is Available Bandwidth, to scale the graph. Each direction can be:
- Automatic — calculated by observing throughput. Click Reset to set it to the current graph maximum.
- Custom… — enter a value in kbit/s, Mbit/s, KByte/s, or MByte/s.
- Static — choose a preset value.
For each direction, Show on Graph draws a line at the maximum level, and Show Label adds a numeric label to that line.
Notifications
Section titled “Notifications”Notify on Reachability Change — posts a notification when this monitor becomes reachable or unreachable.
Advanced
Section titled “Advanced”| Field | Description |
|---|---|
| Swap Up/Down | Swaps inbound and outbound values — downloads become uploads and vice versa. Useful for devices that report traffic the wrong way around. |
| Automatic Scale Factor | When on, traffic is scaled 1×, except for certain Apple AirPort interfaces known to report incorrect data. Turn it off to set a manual Adjust scale factor, which affects throughput, graphs, bandwidth, totals, and usage. |
| Estimate missed usage on restart | When PeakHour restarts, it estimates any usage missed while it wasn’t running. Disable to turn this off. |
| Ask device to smooth data (SNMP only) | Asks the device to refresh its counters every second instead of the default (often 5 s on macOS/Linux snmpd), producing smoother graphs where supported. |
| Lookup interface by name (SNMP only) | Tracks the interface by name rather than by numeric index, so PeakHour doesn’t lose it when the index changes (e.g. after a reboot). May be incompatible with some devices. |
Totals
Section titled “Totals”Shows the total amount of data that has passed through the monitor, and lets you reset it.
Total Traffic — the total inbound, outbound, and combined traffic so far.
Reset
| Setting | Description |
|---|---|
| Automatically reset on the… | When enabled, totals reset automatically on the chosen day of the month. |
| (Day of the month) | Which day to reset on. Set to Every to reset daily at the time below. |
| (at) | The hour to reset on. |
| Reset… | Reset the totals now. |
CSV Logging
Section titled “CSV Logging”Logs activity to a CSV file you can open in Numbers, Excel, or similar.
Log to file — enable logging and choose the Log location. Because of app sandboxing, you must click Choose… to grant PeakHour permission to write there. Reveal in Finder opens that folder.
Frequency
| Setting | Description |
|---|---|
| Write to log every | How often a new record (line) is written. |
| Rotate log file | How often a new log file is started. |
Log state change events — also writes an entry when the monitor’s state changes (interface up/down, sleep/wake, PeakHour start/stop).
Log filename — files are stored in the Log location with a name based on the rotation frequency:
| Rotation | Filename |
|---|---|
| Hourly | <Description> YY-MM-DD HH:MM.csv |
| Daily | <Description> YY-MM-DD.csv |
| Weekly | <Description> YY-MM-DD w.csv (w = week number) |
| Monthly | <Description> YY-MM.csv |
| Yearly | <Description> YYYY.csv |
where <Description> is the monitor’s name.
Log format — each row contains:
| Field | Description |
|---|---|
| Date/Time | The entry’s date and time in your local format. |
| Target | The monitor’s description. |
| Total In Bytes / Total Out Bytes | Total inbound/outbound bytes since the last entry. |
| Total In/Out Bytes (formatted) | Formatted versions of the above. |
| In Bytes/Sec / Out Bytes/Sec | Average inbound/outbound bytes per second over the period. |
Was this page helpful?
Found something wrong, unclear, or out of date? Let us know and we'll fix it.