Latency Monitor
A Latency Monitor pings a host or hop and measures the round-trip time. Its settings are shown on a single scrolling page, organised into the sections below. To open them, select the monitor in the Monitors list — or right-click it and choose Edit….
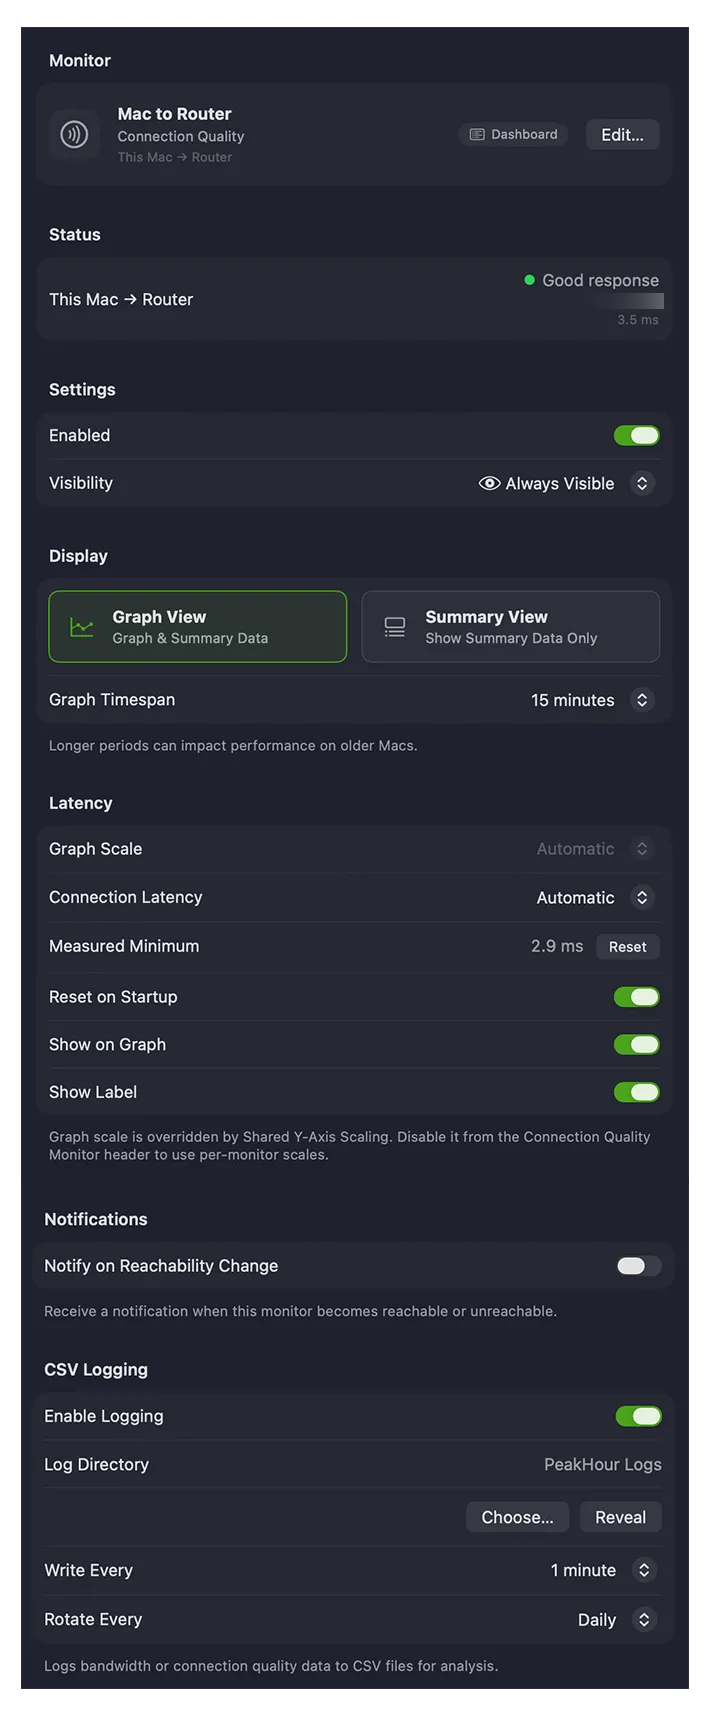
Monitor
Section titled “Monitor”The identity of the monitor.
| Field | Description |
|---|---|
| Symbol | The icon for the monitor. Click it to choose a different one from the symbol picker; it appears in the main view, History view, and (optionally) the menu bar. |
| Name | The description PeakHour uses to refer to this monitor throughout the app. Set something meaningful. |
| Dashboard role | A pill showing which Internet Dashboard hop this monitor is designated as (for example, This Mac to Router), if any. See Designating a Monitor. |
| Edit… | Opens the Configuration Assistant to change what’s measured. |
Status
Section titled “Status”Shows the monitor’s current status and what it’s monitoring. For a multi-host monitor, an error is labelled (Near) or (Far) to show which end it relates to.
Settings
Section titled “Settings”| Field | Description |
|---|---|
| Enabled | Turns monitoring on or off. |
| Visibility | Whether the monitor appears in the main window. Automatic hides it when it can’t be reached; Always Visible always shows it; Always Hide always hides it. A hidden monitor still runs and gathers data. |
Display
Section titled “Display”Controls how the monitor appears in the main window.
View mode
- Graph View — shows the monitor with its graph as well as the details. You can also toggle the graph with the disclosure triangle.
- Summary View — shows the details only, hiding the graph.
Graph Timespan — how many minutes of data the main graph retains. You can scroll the graph vertically to see up to 12 hours back; larger values can affect performance. For older data, use the History view.
Latency colors and the congestion thresholds that drive them are set globally for all monitors — see Display → Latency Colors and Congestion Thresholds. Each monitor’s own minimum-latency baseline, set under Latency below, determines where those thresholds apply.
Latency
Section titled “Latency”Adjusts what PeakHour treats as ‘normal’ (minimum) latency — the baseline for the Normal, Slight Congestion, and Heavy Congestion colors.
| Field | Description |
|---|---|
| Connection Latency | The minimum-latency baseline. Automatic detects and measures it for you; or drag the slider to set it manually. |
| Measured Minimum | The currently measured minimum latency. Click Reset to re-measure. |
| Reset on Startup (Automatic only) | Resets the minimum each time PeakHour starts or monitors are reset. On by default. |
| Show on Graph | Draws the minimum-latency line on the graph. |
| Show Label | Adds the minimum value to that line. |
Notifications
Section titled “Notifications”Notify on Reachability Change — posts a notification when this monitor becomes reachable or unreachable.
CSV Logging
Section titled “CSV Logging”Logs average latency to a CSV file you can open in Numbers, Excel, or similar.
Log to file — enable logging and choose the Log Directory. Because of app sandboxing, you must click Choose… to grant PeakHour permission to write there. Reveal opens that folder in Finder.
Frequency
| Setting | Description |
|---|---|
| Write Every | How often a new record (line) is written. |
| Rotate Every | How often a new log file is started. |
Log filename — files are stored in the Log Directory with a name based on the rotation frequency:
| Rotation | Filename |
|---|---|
| Hourly | <Description> YY-MM-DD HH:MM.csv |
| Daily | <Description> YY-MM-DD.csv |
| Weekly | <Description> YY-MM-DD w.csv (w = week number) |
| Monthly | <Description> YY-MM.csv |
| Yearly | <Description> YYYY.csv |
where <Description> is the monitor’s name.
Log format — each row contains:
| Field | Description |
|---|---|
| Date/Time | The entry’s date and time in your local format. |
| Target | The monitor’s description. |
| Average Response Time (ms) | The average latency over the period. |
Was this page helpful?
Found something wrong, unclear, or out of date? Let us know and we'll fix it.