Main View
Opening the main window
Section titled “Opening the main window”PeakHour’s main window is your primary view into network activity. There are two ways to open it:
From the menu bar. Click the PeakHour menu bar item. The exact information shown there depends on which Menu Bar Items you have configured in Settings → Menu Bar.

From the Dock. Click PeakHour’s Dock icon if it’s enabled. The Dock icon is on by default — toggle it from Settings → Dashboard.
![]()
Overview
Section titled “Overview”The main window stacks four sections vertically:
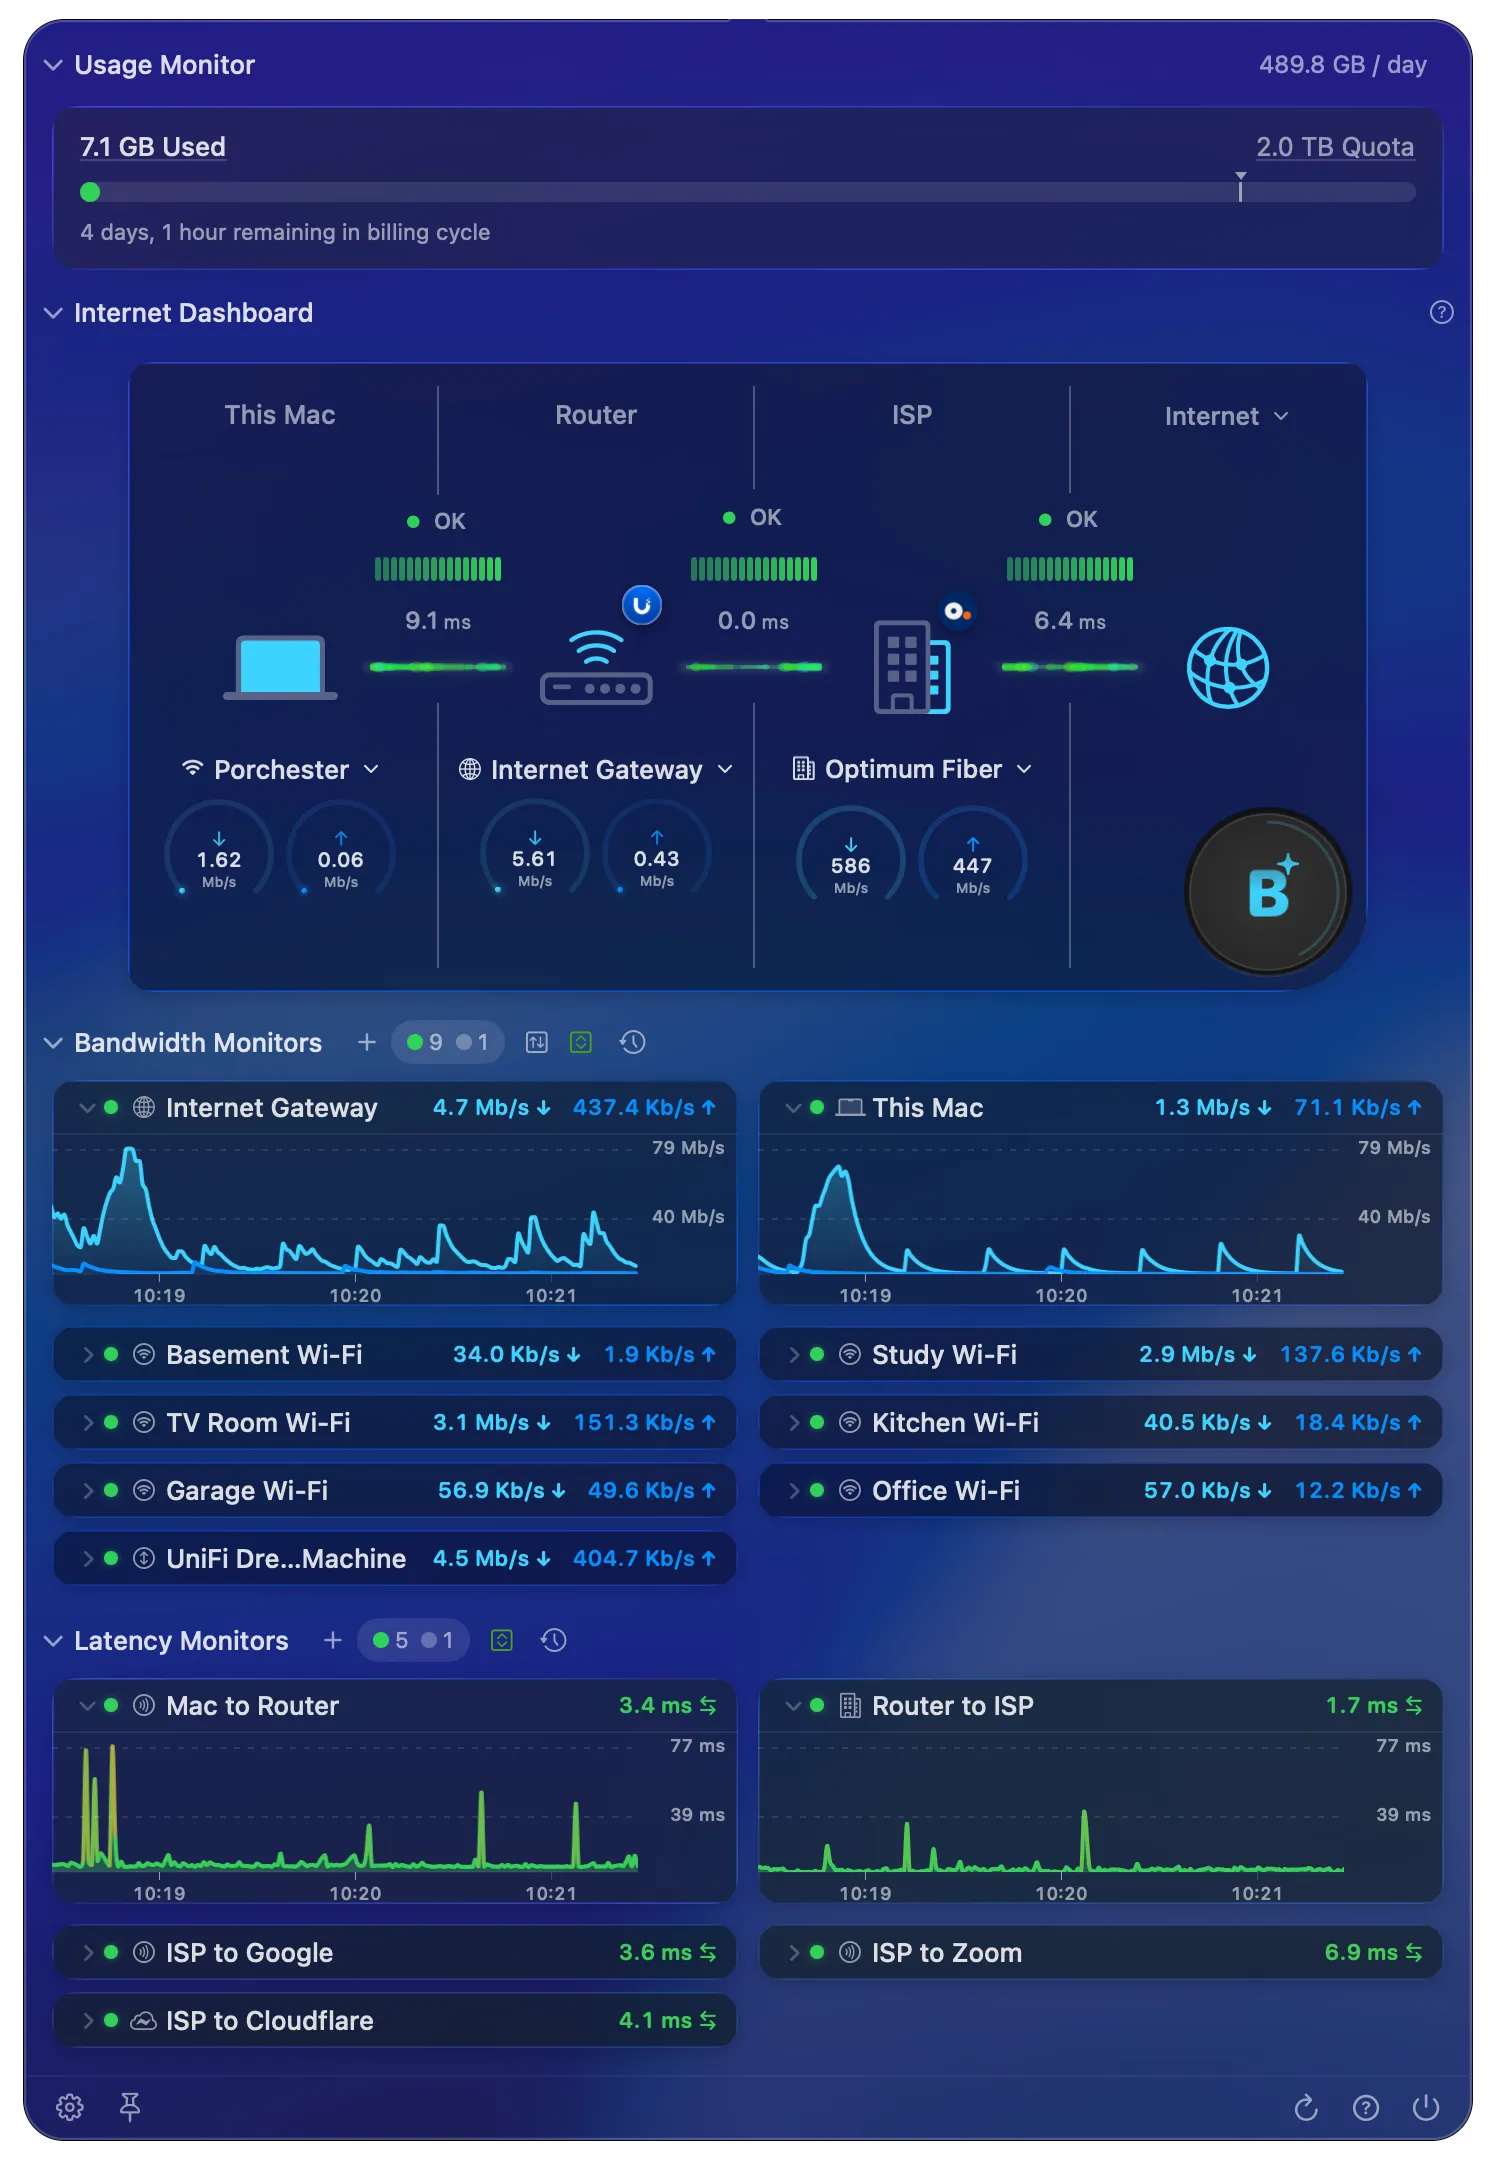
- Usage Monitor — tracks data used and remaining against your billing cycle quota. Only visible when Usage Monitoring is enabled.
- Internet Dashboard — a single-view summary of your connection’s health from your Mac out to the internet.
- Bandwidth Monitors — real-time throughput graphs for each device or interface you’ve configured.
- Latency Monitors — round-trip latency, jitter, and packet loss for hosts on the internet.
Was this page helpful?
Found something wrong, unclear, or out of date? Let us know and we'll fix it.