Dashboard
The Dashboard settings are where you enable and configure the Internet Dashboard — a real-time view of your internet latency, throughput, and connection health.
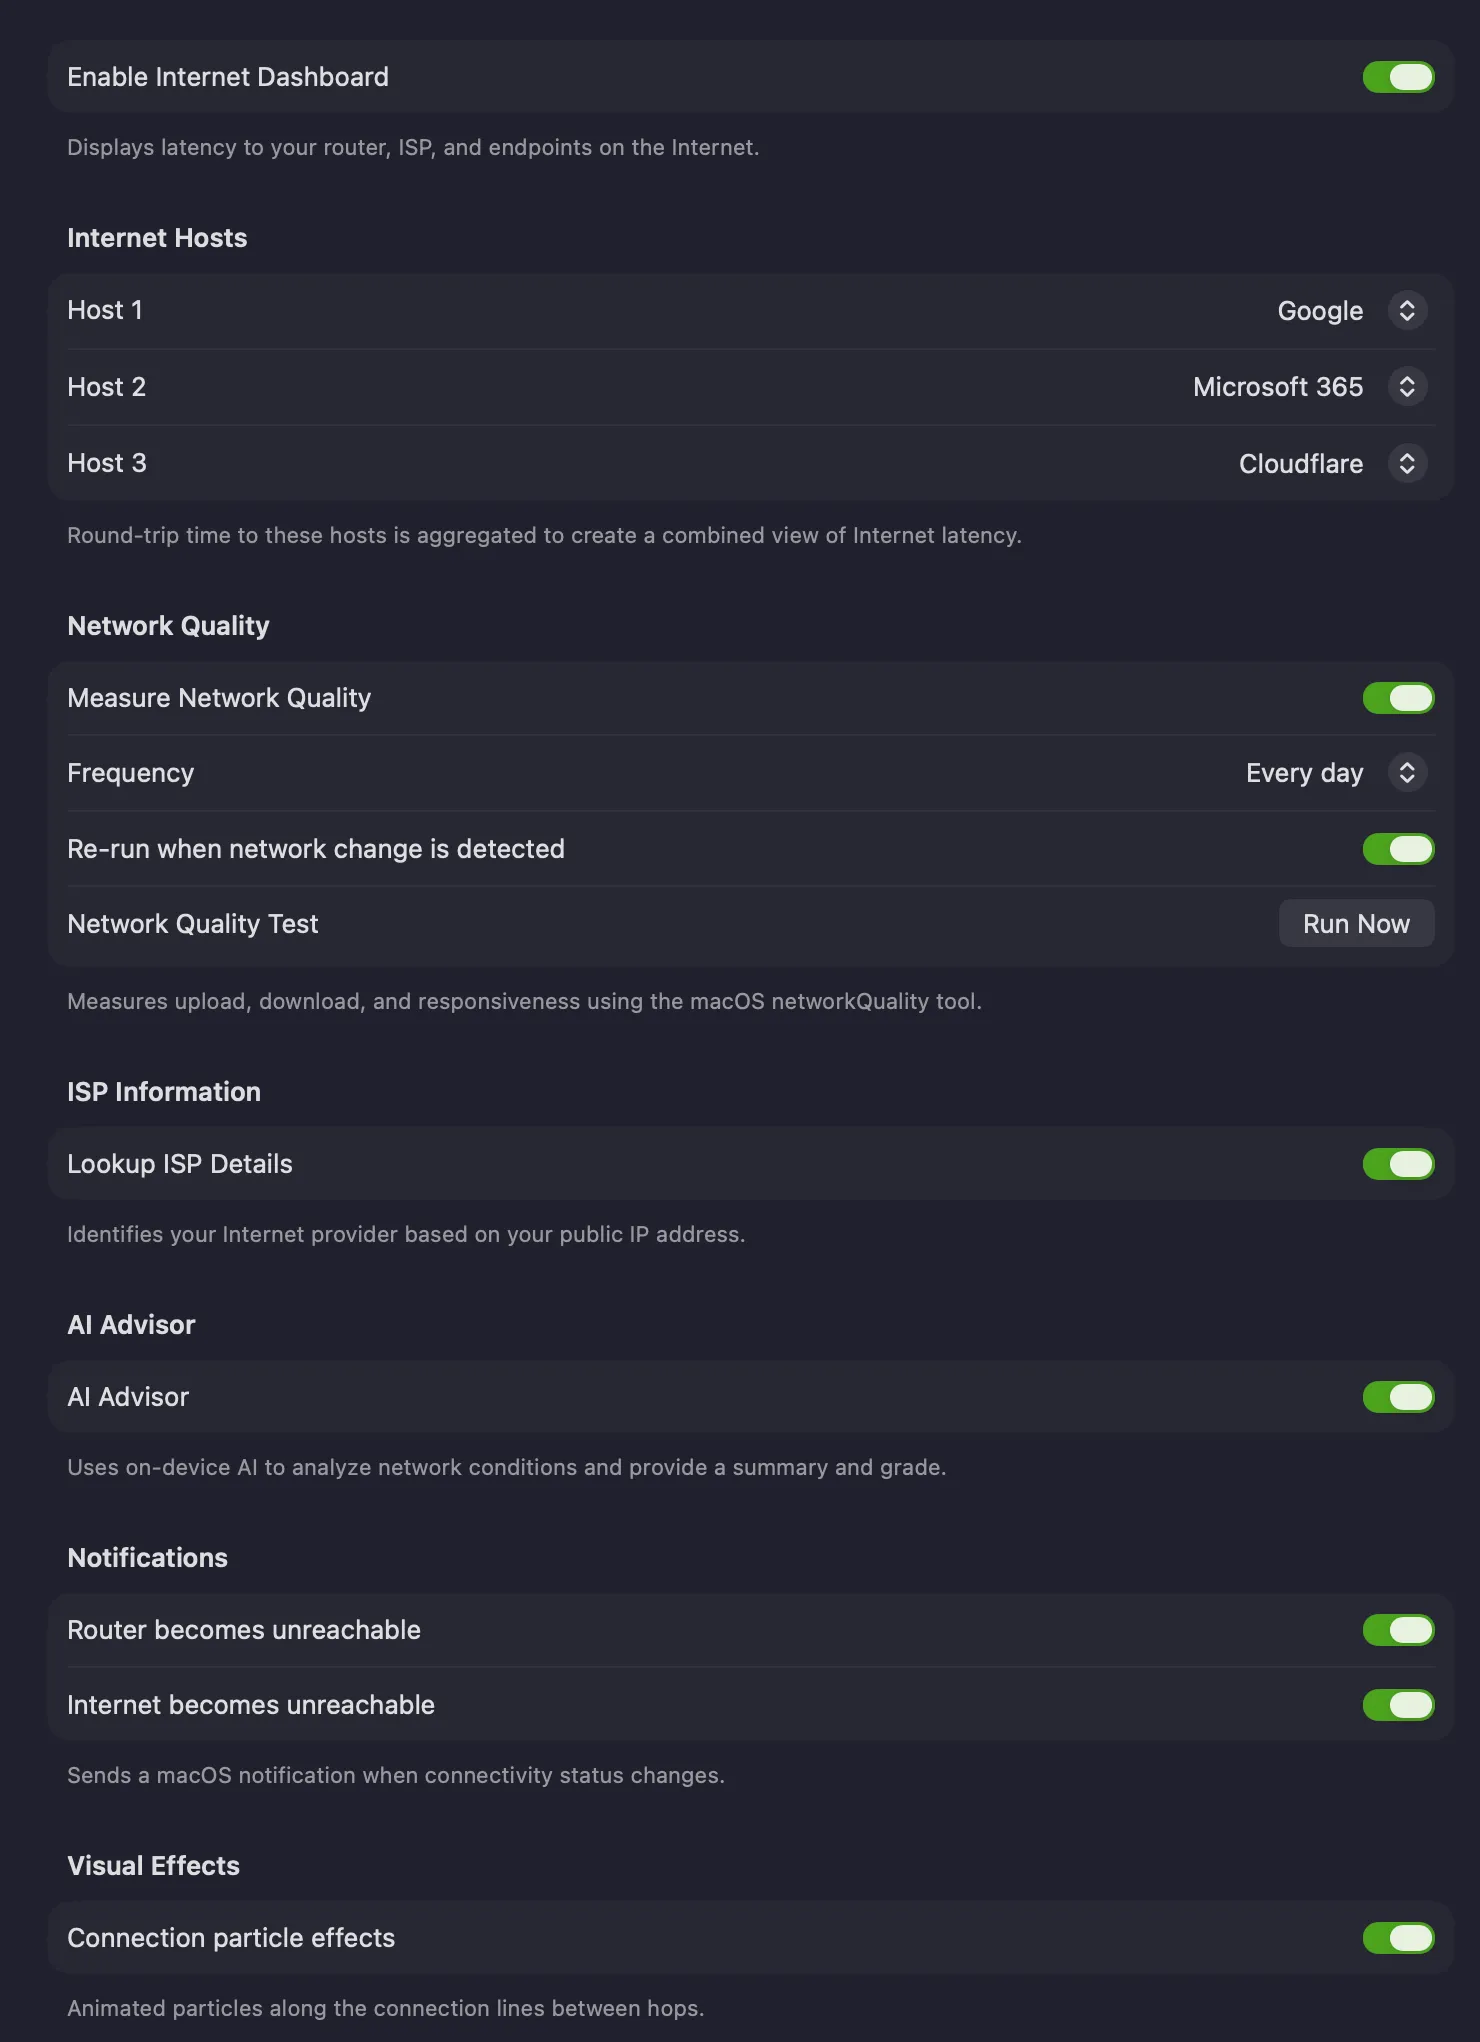
Enable Internet Dashboard — turns the Internet Dashboard on and shows it on the main display, displaying latency to your router, ISP, and endpoints on the internet. For what it shows, see Internet Dashboard.
Internet Hosts
Section titled “Internet Hosts”PeakHour continually pings three hosts and aggregates the round-trip times into a combined view of internet latency. Choose services you use often.
Host 1, 2, 3 — the service to ping for each slot. Each dropdown offers a large list of popular services and DNS providers: Akamai, Amazon, Amazon AWS, Apple, Apple TV+, Cloudflare, Disney+, Fastly, GitHub, Google, Google Cloud, Meta (Facebook), Microsoft 365, Microsoft Azure, Netflix, OpenDNS, PlayStation Network, Quad9, Reddit, Slack, Spotify, Steam, Twitch, X (Twitter), Xbox Live, YouTube, and Zoom. Choose None to leave a slot empty, or Custom… to enter your own hostname or IP address.
These hosts appear in the Internet segment’s popover on the dashboard.
Network Quality
Section titled “Network Quality”PeakHour can periodically measure your connection’s upload speed, download speed, and responsiveness using the macOS networkQuality tool, and show the results on the Internet Dashboard.
| Setting | Description |
|---|---|
| Measure Network Quality | Enables periodic measurement. Results appear under ISP on the dashboard and in the Network Quality Report. Running a test also calibrates your Internet Gateway’s maximum available upload and download bandwidth. |
| Frequency | How often the test runs — every hour, 6 hours, 12 hours, day, or week. |
| Re-run when network change is detected | Also runs a test automatically whenever PeakHour detects a network change, such as switching Wi-Fi networks. |
| Network Quality Test → Run Now | Runs a test immediately. You can also right-click the Internet Dashboard and run it from there. |
ISP Information
Section titled “ISP Information”Lookup ISP Details — identifies your internet provider (name, ASN, connection type, and approximate location) from your public IP address, shown in the ISP segment’s popover on the dashboard.
AI Advisor
Section titled “AI Advisor”AI Advisor — uses on-device AI to analyse your network conditions and produce a plain-language summary and an overall grade. See AI Advisor.
Notifications
Section titled “Notifications”Send a macOS notification when connectivity changes — both when a connection drops and when it comes back:
- Router becomes unreachable — notifies you when your router stops responding, and again when it recovers.
- Internet becomes unreachable — notifies you when the wider internet stops responding, and again when it recovers.
Visual Effects
Section titled “Visual Effects”Connection particle effects — animated particles flow along the connection lines between hops on the dashboard, visualising live traffic. Disable to turn the animation off.
Recreating Internet Dashboard monitors
Section titled “Recreating Internet Dashboard monitors”If you delete one or more of the monitors that power the Internet Dashboard, the only way to restore them is to recreate them all:
- Open Dashboard settings.
- Disable the Internet Dashboard.
- When prompted whether to delete all monitors associated with the Internet Dashboard, choose Yes, remove all Dashboard monitors.
- Re-enable the Internet Dashboard.
This recreates all Internet Dashboard monitors with their default settings.
Was this page helpful?
Found something wrong, unclear, or out of date? Let us know and we'll fix it.