Menu Bar
The Menu Bar settings let you choose which monitors appear in the macOS menu bar and configure how each one looks.
Appearance
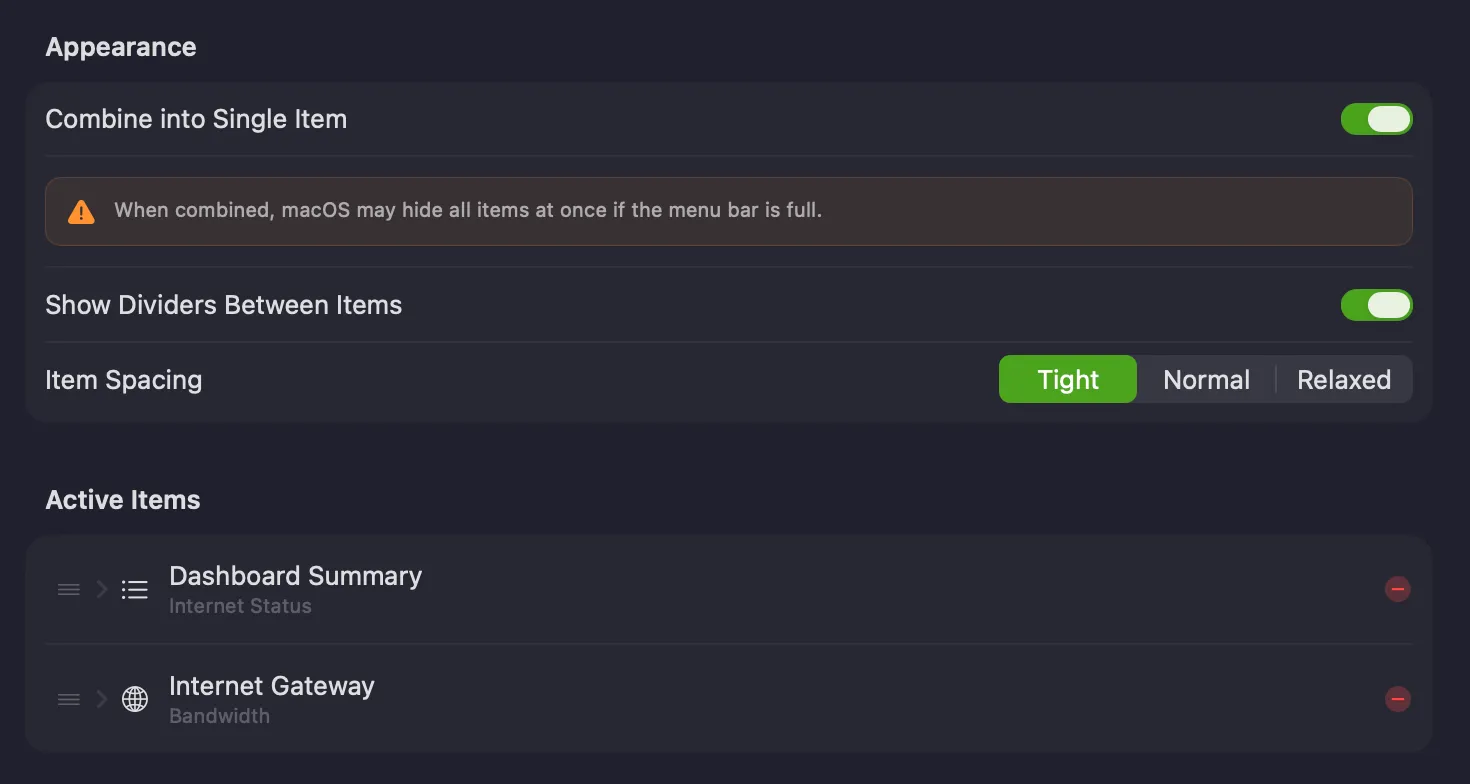
Section titled “Appearance”Controls how PeakHour’s menu bar items are presented as a group.
| Setting | Description |
|---|---|
| Combine into Single Item | Groups all of PeakHour’s menu bar items into one combined item. When combined, macOS may hide all of them at once if the menu bar runs out of room. |
| Show Dividers Between Items | Draws a divider between adjacent items. |
| Item Spacing | The gap between items — Tight, Normal, or Relaxed. |
Active Items
Section titled “Active Items”The Active Items list shows what’s currently in your menu bar.
- Reorder an item by dragging the handle on its left.
- Remove an item by clicking the red −.
- Configure an item by clicking its disclosure chevron to expand its options.
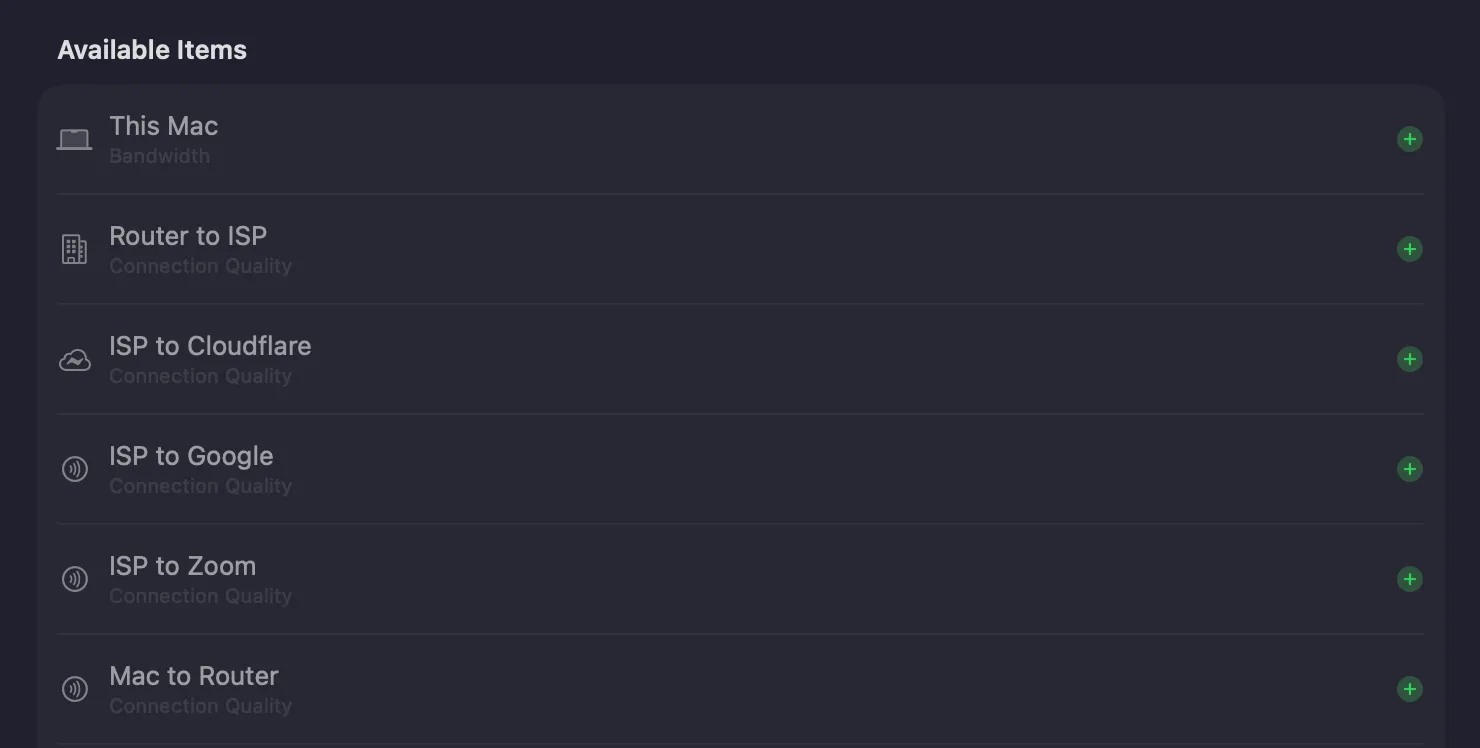
Below it, the Available Items list shows the monitors and summaries that aren’t in the menu bar yet. Click the ![]() button beside one to add it to the menu bar.
button beside one to add it to the menu bar.
Active items can be configured by type. Different item types have different options, described below.
Bandwidth Menu Bar Item
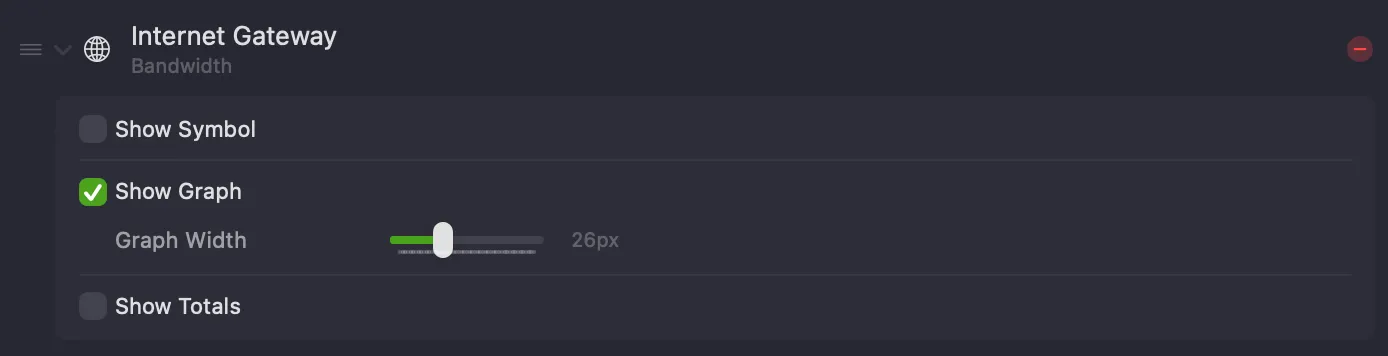
Section titled “Bandwidth Menu Bar Item”Shows a Bandwidth Monitor’s upload and download throughput in the menu bar.
The numbers are arranged:
- Top left: current upload speed
- Bottom left: current download speed
- Top right: total uploaded (when Show Totals is on)
- Bottom right: total downloaded (when Show Totals is on)
| Setting | Description |
|---|---|
| Show Symbol | Shows the monitor’s symbol, which helps tell similar monitors apart at the cost of a little menu bar space. |
| Show Graph | Shows a small graph beside the numbers. |
| Graph Width | The width of that graph. |
| Show Totals | Also shows the monitor’s totals. See Totals. |
Latency Menu Bar Item
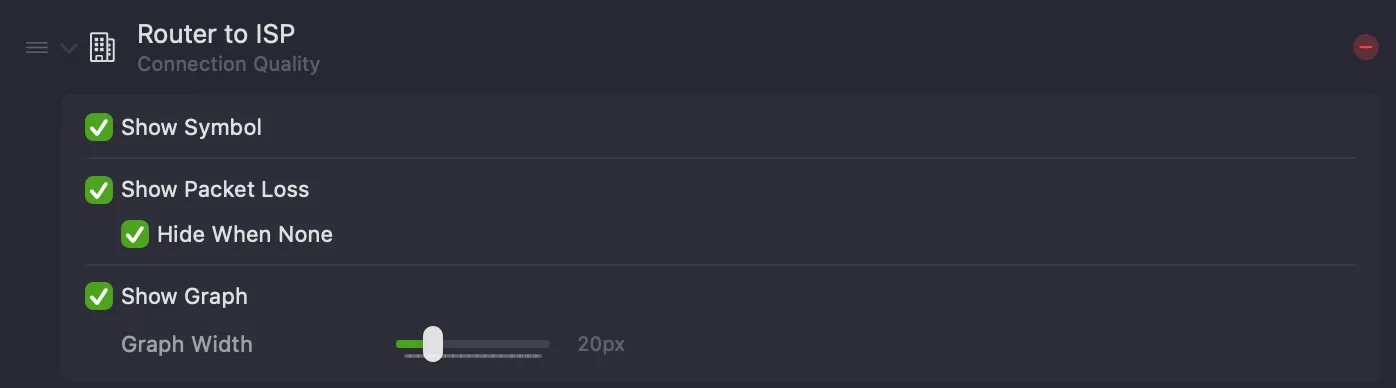
Section titled “Latency Menu Bar Item”Shows a Latency Monitor’s latency, and optionally packet loss, in the menu bar.
The numbers are:
- Top: current latency, in milliseconds.
- Bottom: packet loss (%) over the past 5 minutes.
| Setting | Description |
|---|---|
| Show Symbol | Shows the monitor’s symbol. |
| Show Packet Loss | Shows packet loss (%) below the latency value. |
| Hide When None | Only shows packet loss when some has occurred in the past 5 minutes; otherwise just the latency is shown. |
| Show Graph | Shows a small graph beside the latency value. |
| Graph Width | The width of that graph. |
Dashboard Summary (Internet Status)
Section titled “Dashboard Summary (Internet Status)”A special item that summarises your internet status from the Internet Dashboard — a row of hop icons running from your Mac (left) to the internet (right), each coloured by status. It’s only available when the Internet Dashboard is enabled.
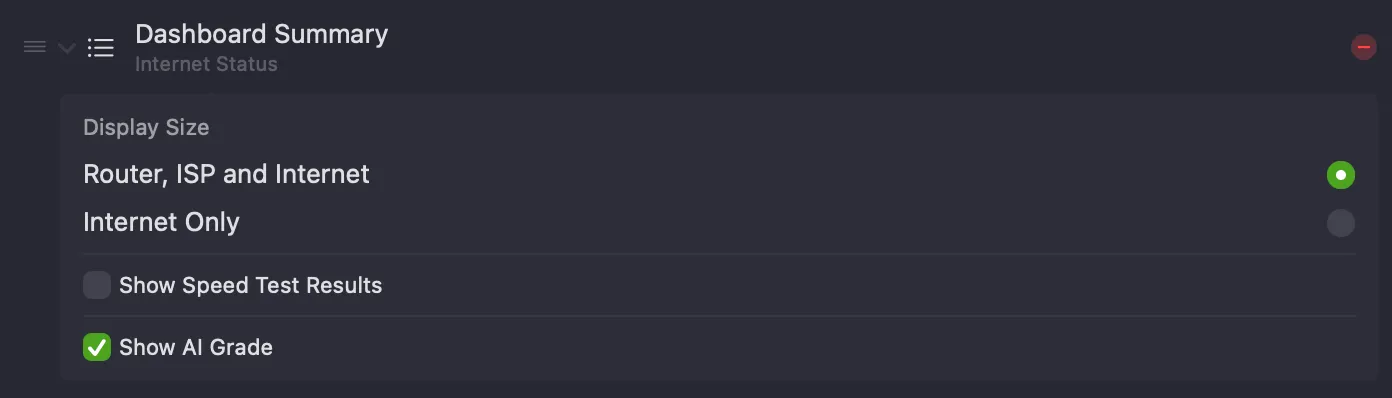
Each hop icon is coloured by its current status — green for OK, yellow for congestion, with a packet-loss indicator when loss has occurred in the past 5 minutes.
| Setting | Description |
|---|---|
| Display Size | Router, ISP and Internet shows every hop; Internet Only shows just the final hop for a more compact item. |
| Show Speed Test Results | Includes the latest Network Quality (speed test) results. |
| Show AI Grade | Includes the AI Advisor letter grade. |
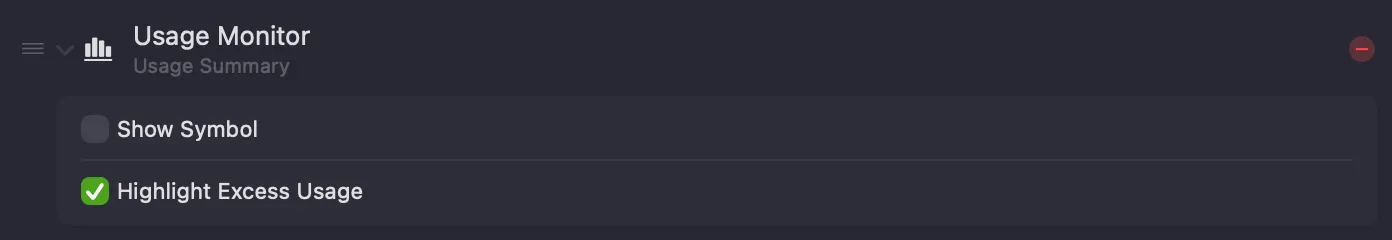
Usage Monitor
Section titled “Usage Monitor”A special item that shows your current internet usage, as measured by the Usage Monitor. See Usage Monitoring.
| Setting | Description |
|---|---|
| Show Symbol | Shows the Usage Monitor symbol in the item. |
| Highlight Excess Usage | Shows usage in red when your usage per day exceeds what’s left for the period. |
Was this page helpful?
Found something wrong, unclear, or out of date? Let us know and we'll fix it.